 QQ咨询
QQ咨询 阿里旺旺
阿里旺旺 #skype#
AWS CloudWatch Logs监控Apache日志文件
AWS CloudWatch Logs?
AWS于2014年7月发布了CloudWatch Logs服务,在使用AWS服务时我们可使用CloudWatch Logs对中间件及应用程序生成的任何日志文件进行监控。利用指标设置警报,并组合SNS发送告警邮件。
在这里简单介绍以下如何使用CloudWatch Logs监控Apache的Error日志文件。
使用CloudWatch Logs监控Apache日志文件
具体的操作步骤如下;
- 创建EC2(AMI选择CentOS7)
- 添加IAM权限启动EC2
- 安装Apache并启动
- 安装CloudWatch Logs代理(Agent)
- 查看CloudWatch Logs搜集的日志内容
- 编辑事件保留时间
- 创建筛选条件
- 创建警报
使用CloudWatch Logs步骤
启动Amazon EC2
参照Amazon EC2分配IAM角色,启动Amazon EC2实例。
安全组需要允许22端口及80端口访问。
安装Apache
# yum -y update
# yum -y install httpd
# systemctl start httpd
安装CloudWatch Logs代理(Agent)
# yum -y install wget
# wget https://s3.amazonaws.com/aws-cloudwatch/downloads/latest/awslogs-agent-setup.py
# python ./awslogs-agent-setup.py --region ap-northeast-1
Launching interactive setup of CloudWatch Logs agent ...

Step 1 of 5: Installing pip ...DONE

Step 2 of 5: Downloading the latest CloudWatch Logs agent bits ... DONE

Step 3 of 5: Configuring AWS CLI ...
AWS Access Key ID [None]:
AWS Secret Access Key [None]:
Default region name [ap-northeast-1]:
Default output format [None]:

Step 4 of 5: Configuring the CloudWatch Logs Agent ...
Path of log file to upload [/var/log/messages]: /var/log/httpd/error_log
Destination Log Group name [/var/log/httpd/error_log]:

Choose Log Stream name:
  1. Use EC2 instance id.
  2. Use hostname.
  3. Custom.
Enter choice [1]:

Choose Log Event timestamp format:
  1. %b %d %H:%M:%S    (Dec 31 23:59:59)
  2. %d/%b/%Y:%H:%M:%S (10/Oct/2000:13:55:36)
  3. %Y-%m-%d %H:%M:%S (2008-09-08 11:52:54)
  4. Custom
Enter choice [1]:

Choose initial position of upload:
  1. From start of file.
  2. From end of file.
Enter choice [1]:
More log files to configure? [Y]: N

Step 5 of 5: Setting up agent as a daemon ...DONE


------------------------------------------------------
- Configuration file successfully saved at: /var/awslogs/etc/awslogs.conf
- You can begin accessing new log events after a few moments at https://console.aws.amazon.com/cloudwatch/home?region=ap-northeast-1#logs:
- You can use 'sudo service awslogs start|stop|status|restart' to control the daemon.
- To see diagnostic information for the CloudWatch Logs Agent, see /var/log/awslogs.log
- You can rerun interactive setup using 'sudo python ./awslogs-agent-setup.py --region ap-northeast-1 --only-generate-config'
------------------------------------------------------
查看CloudWatch Logs搜集的日志内容
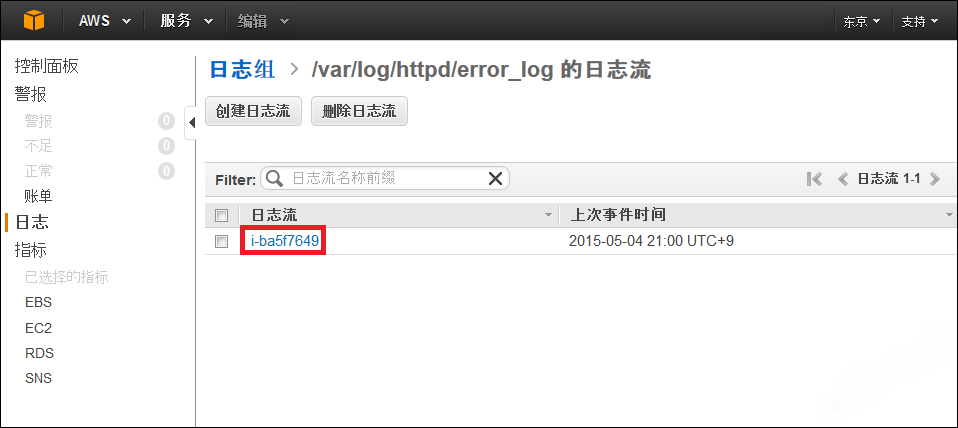
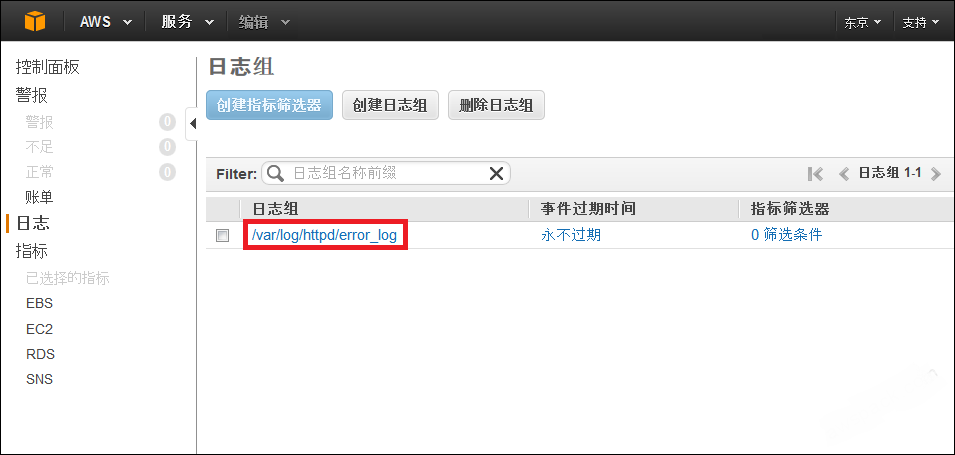
AWS管理页面点击[CloudWatch] -> [日志] -> 日志组[/var/log/httpd/error_log]。
 点击日志六[i-ba5f7649]。
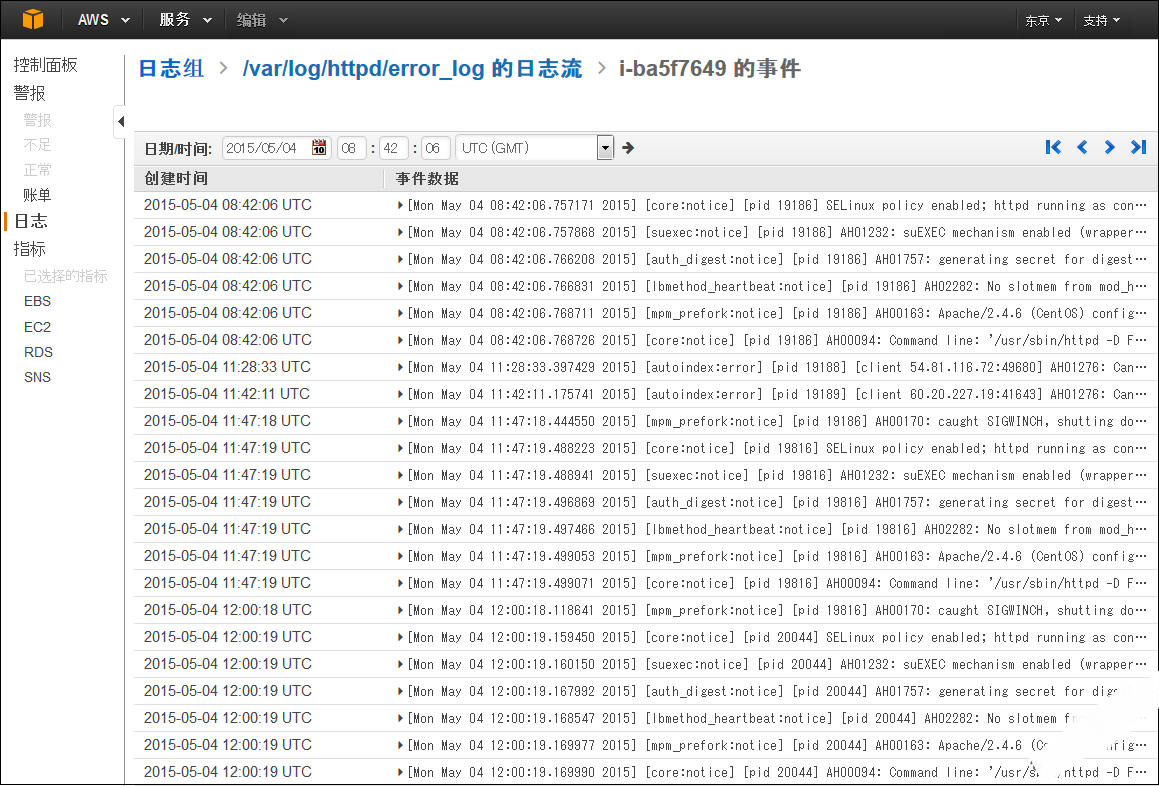
确认到Apache的Error日志文件内容,但是时间全部是UTC。
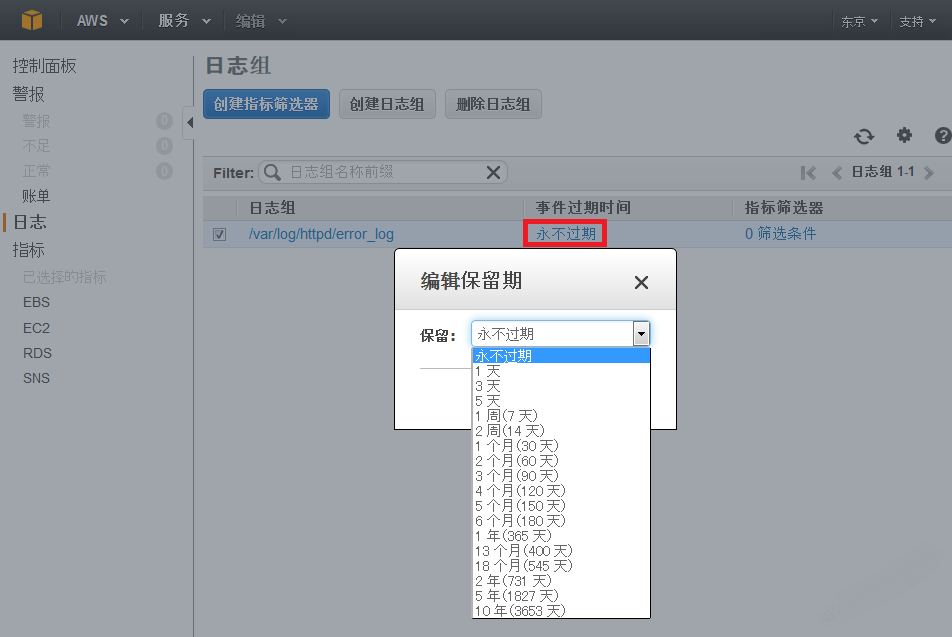
编辑事件保留时间
事件的保存时间默认是[永不过期],点击[永不过期]可编辑保留时间。
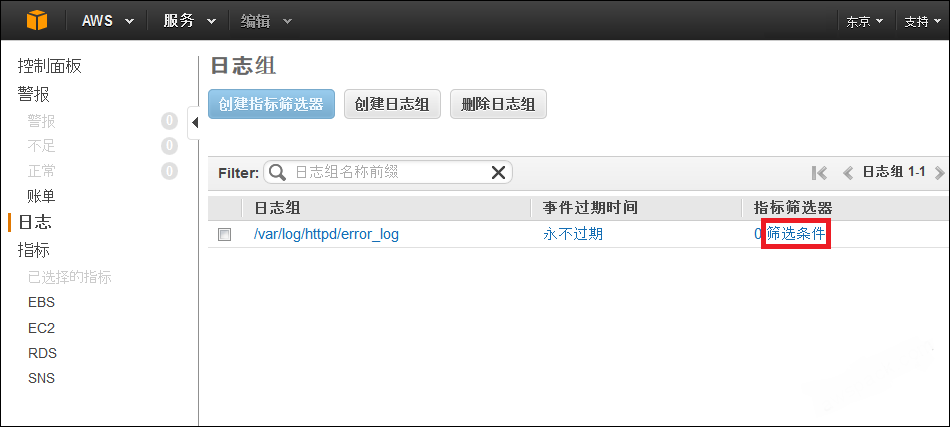
创建筛选条件
点击[筛选条件]。
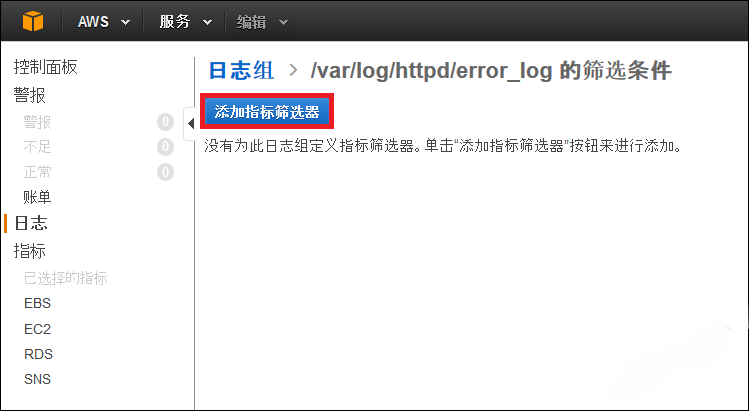
 点击[添加指标筛选器]。
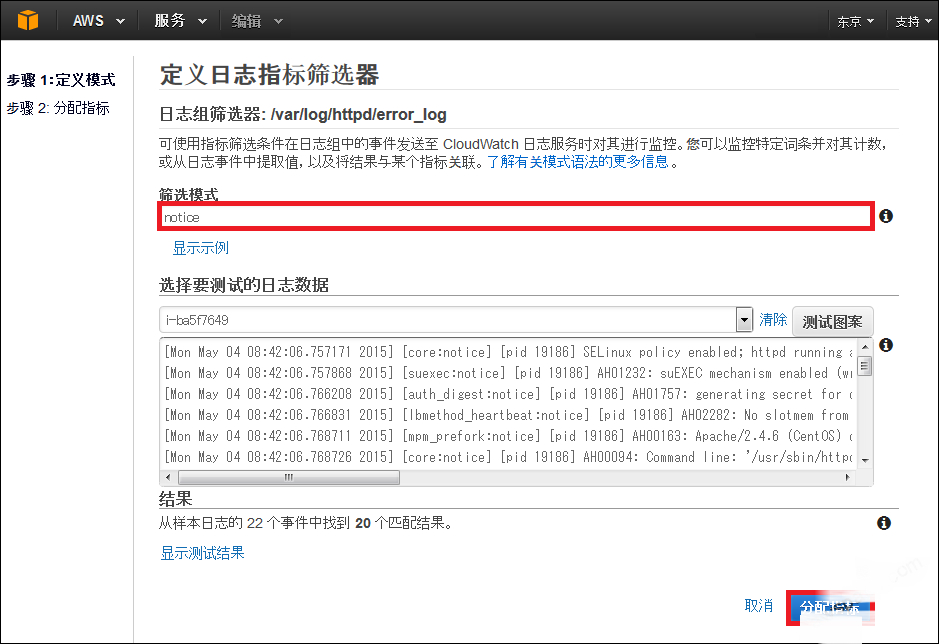
筛选模式填写[notice]后,点击[分配指标]。点击[测试图案],可查看到当前日志文件内容里匹配的有多少个事件。
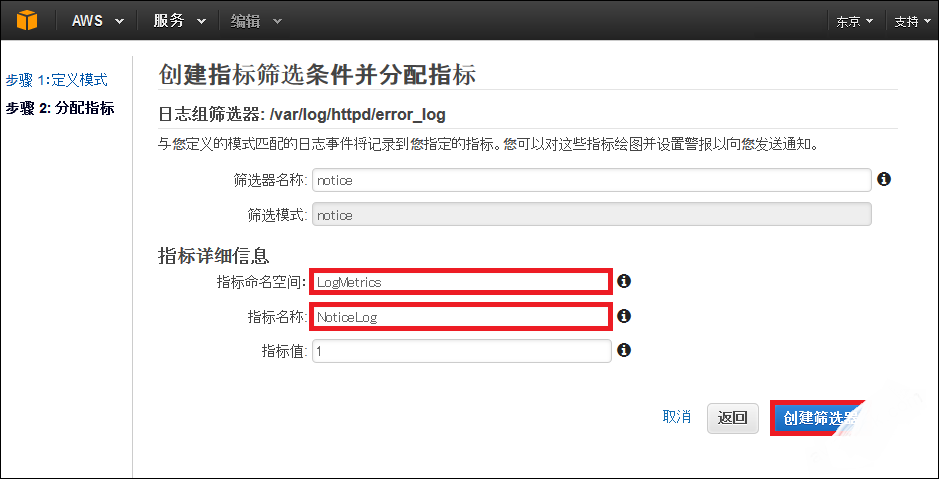
 指标命名空间填写[LogMetrics],指标名称填写[NoticeLog]后点击[创建筛选器]。
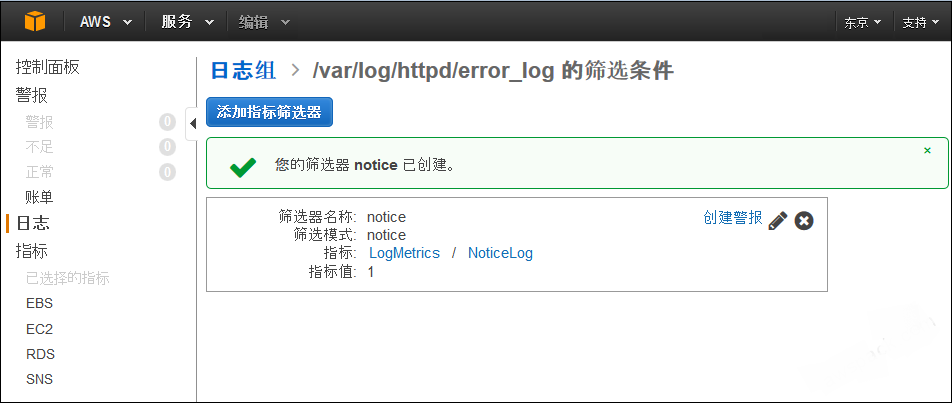
 创建筛选条件成功。
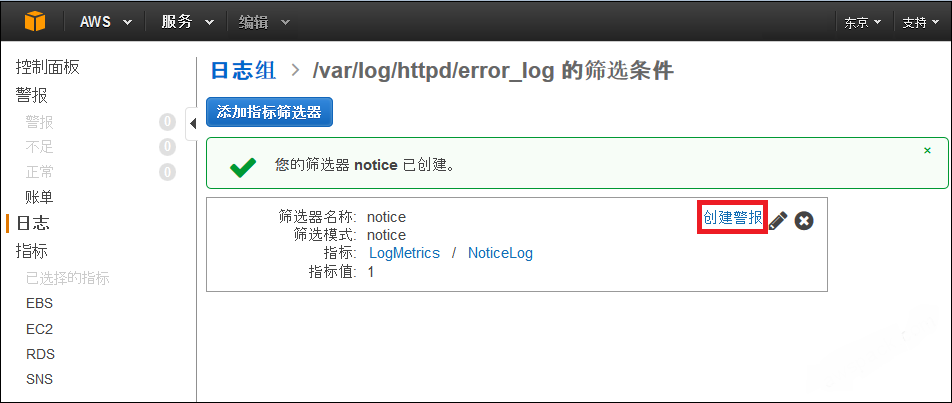
创建警报
点击[创建警报]。
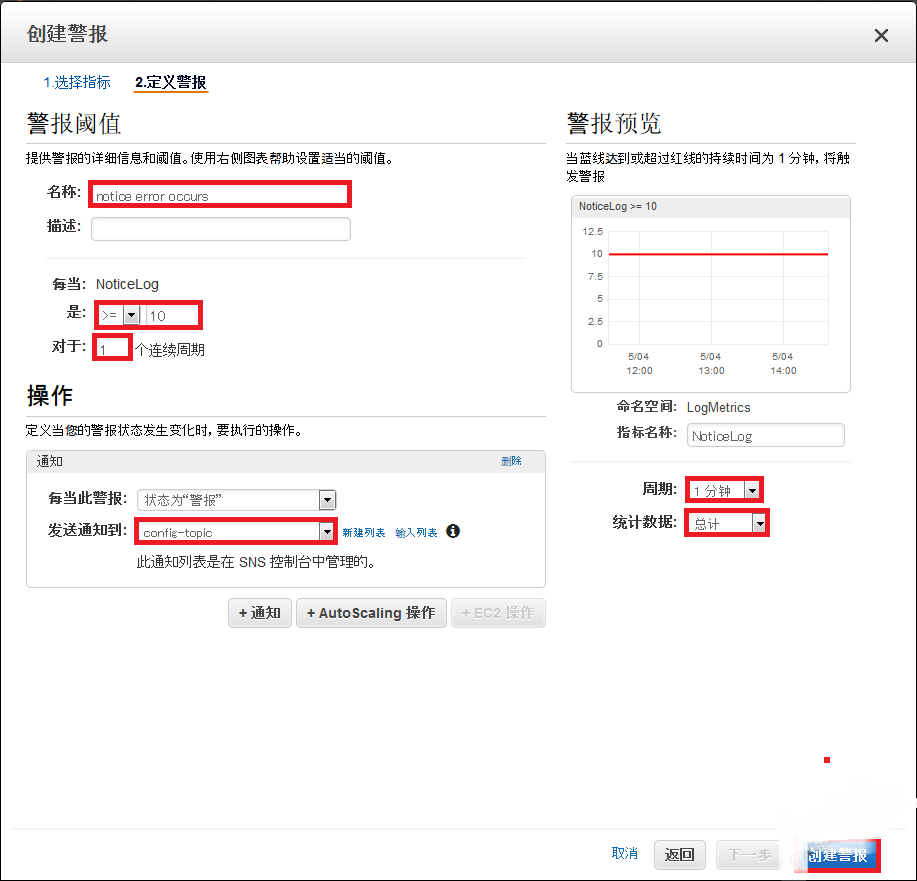
 在Apache报错日志文件里1分钟内出现10次以上notice关键字时,CloudWatch会通过SNS发送警报。
- 名称:notice error occurs <- 可填写任意名称
- 是 >= 10 <- 阀值为10次以上
- 对于 1 个连续周期 <- 指定周期
- 每当此警报:状态为”警报” <- 定义此警报的严重度
- 发送通知到:config-topic <- 选择SNS
- 周期:1分钟
- 统计数据:总计
- 点击[创建警报]
结语
用CloudWatch Logs可简单的监控任何日志文件,更重要的是其实时性。我们使用Auto Scaling时,当实例发生异常时我们会丢失该实例上的所有数据,通过CloudWatch Logs实时的搜集其日志文件也是非常好的一个解决方案。